Undergraduate Research:
Electrostatic DEM Analysis of Charged Lunar Regolith
During my senior year at NC State, I conducted research in the Porous Media and Multiphase Flow (PMMF) Laboratory to analyze and draw tangible conclusions from NCSU-written DEM results using MATLAB.
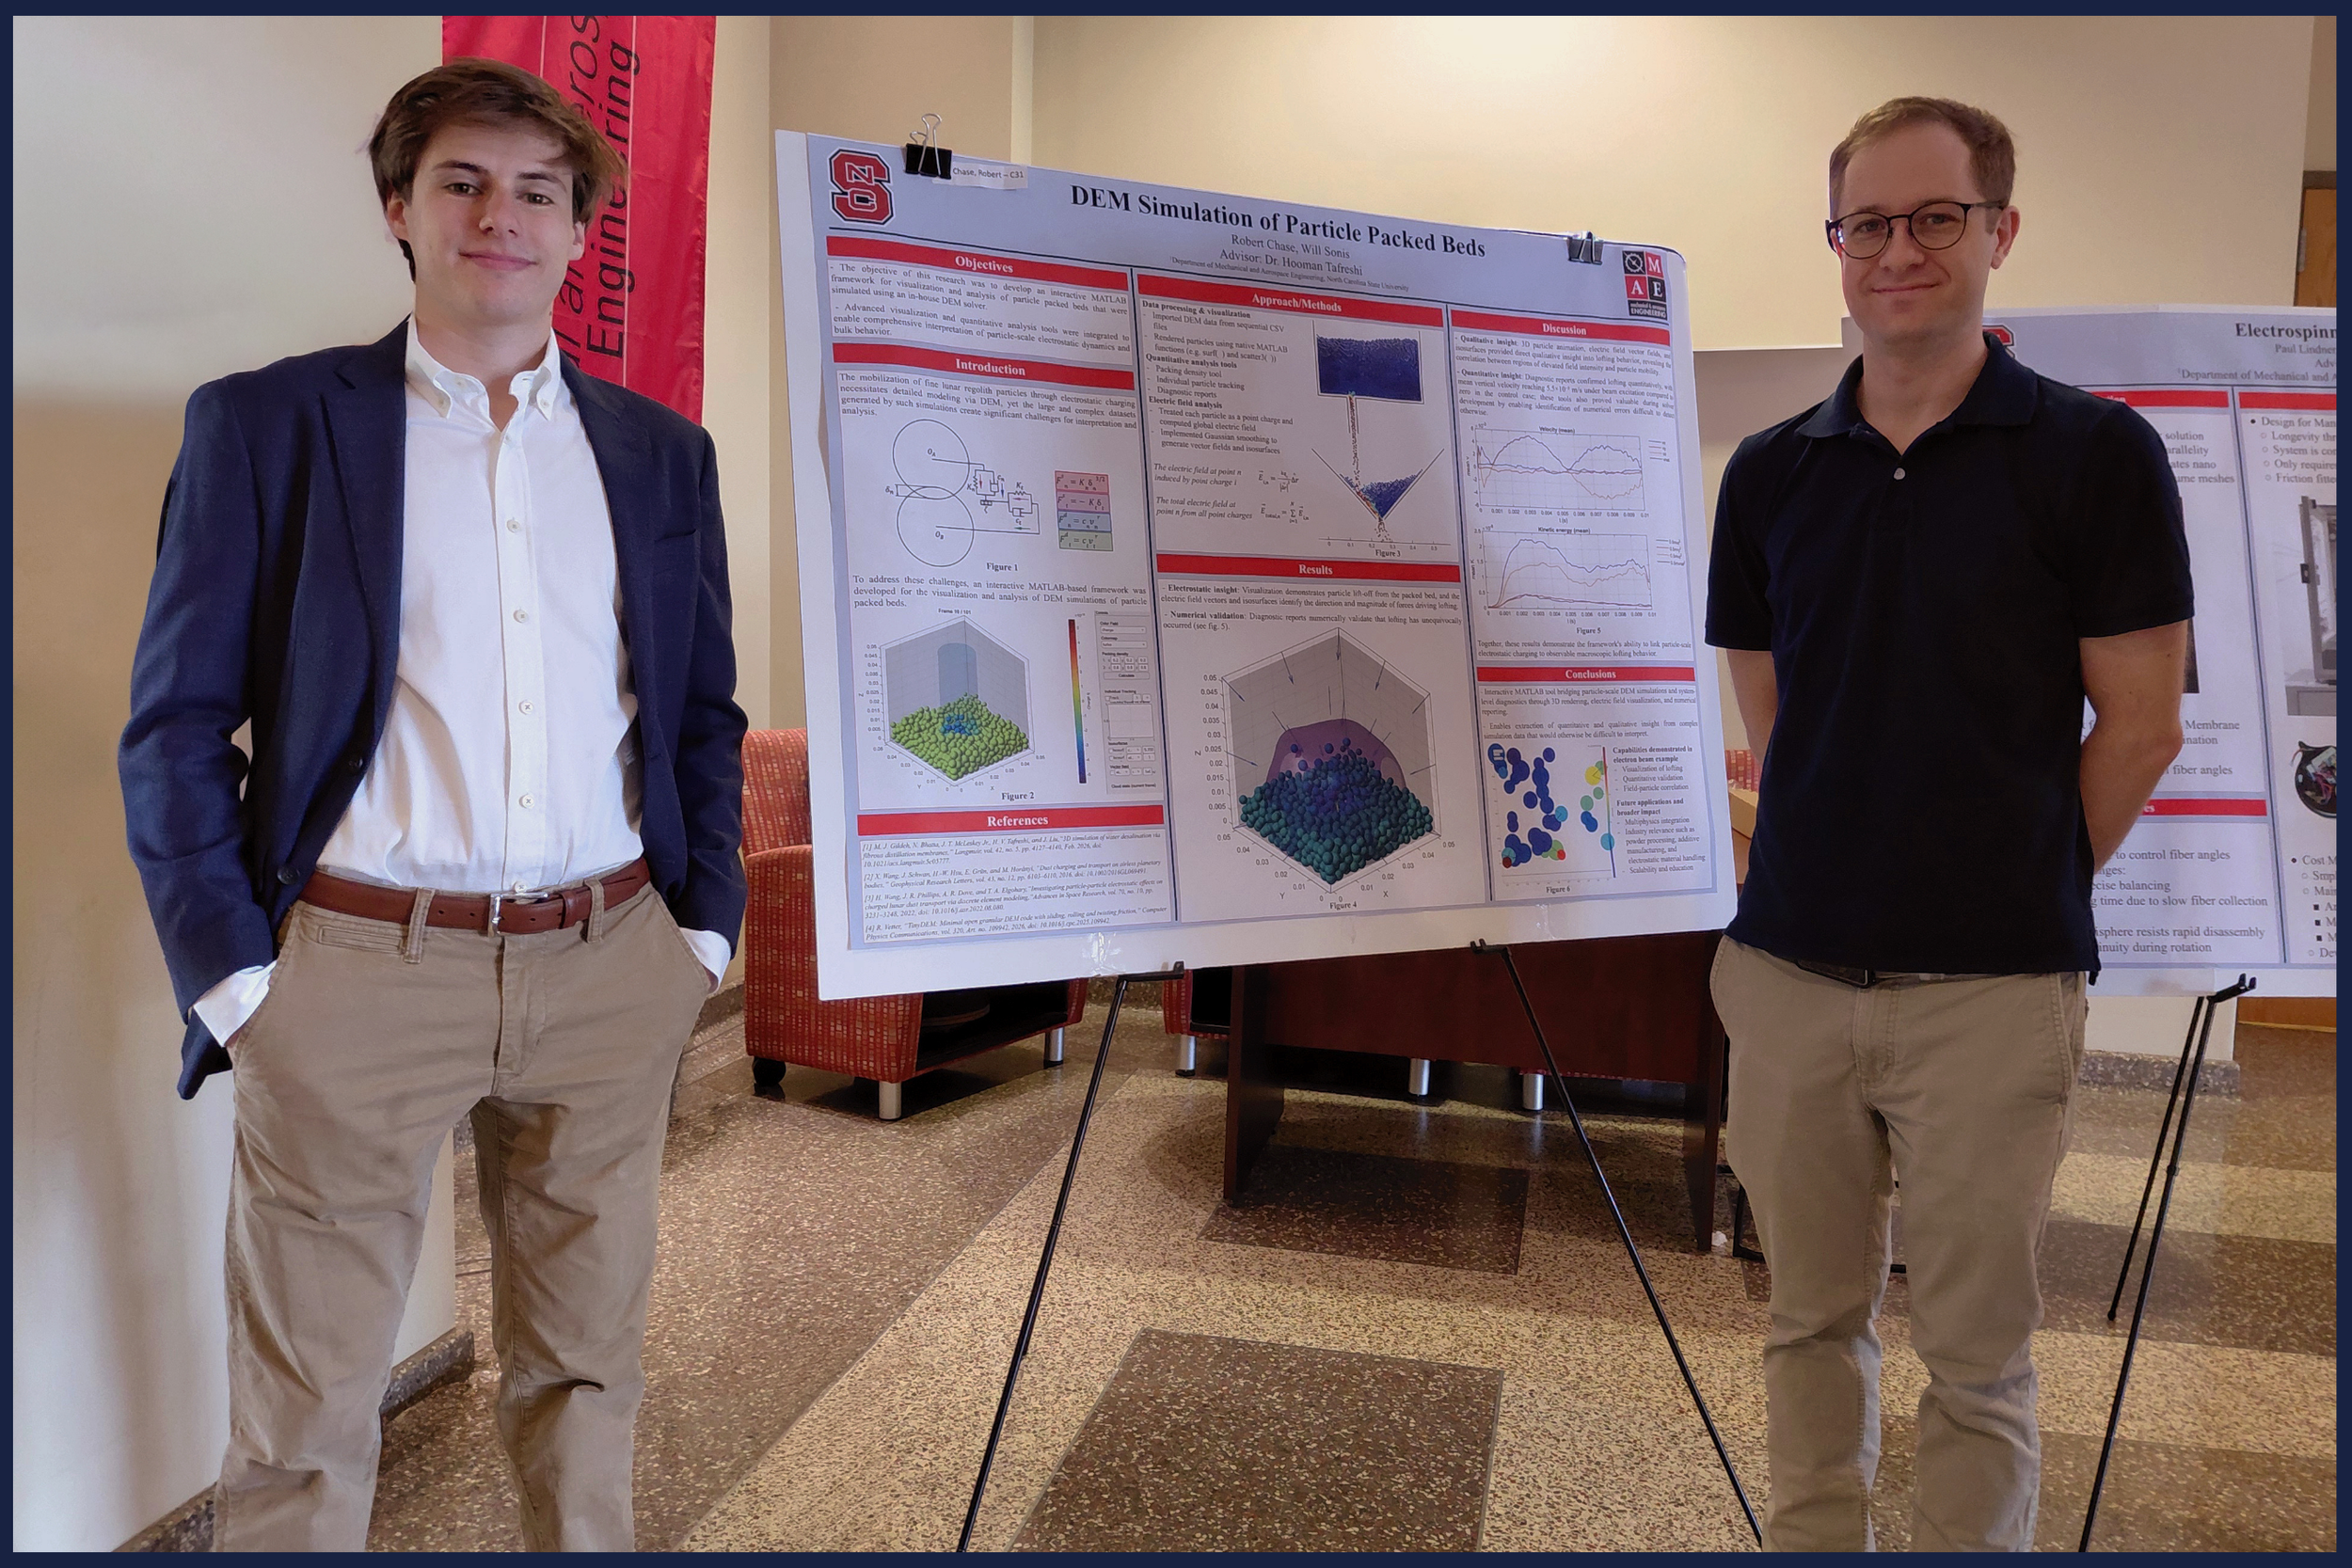
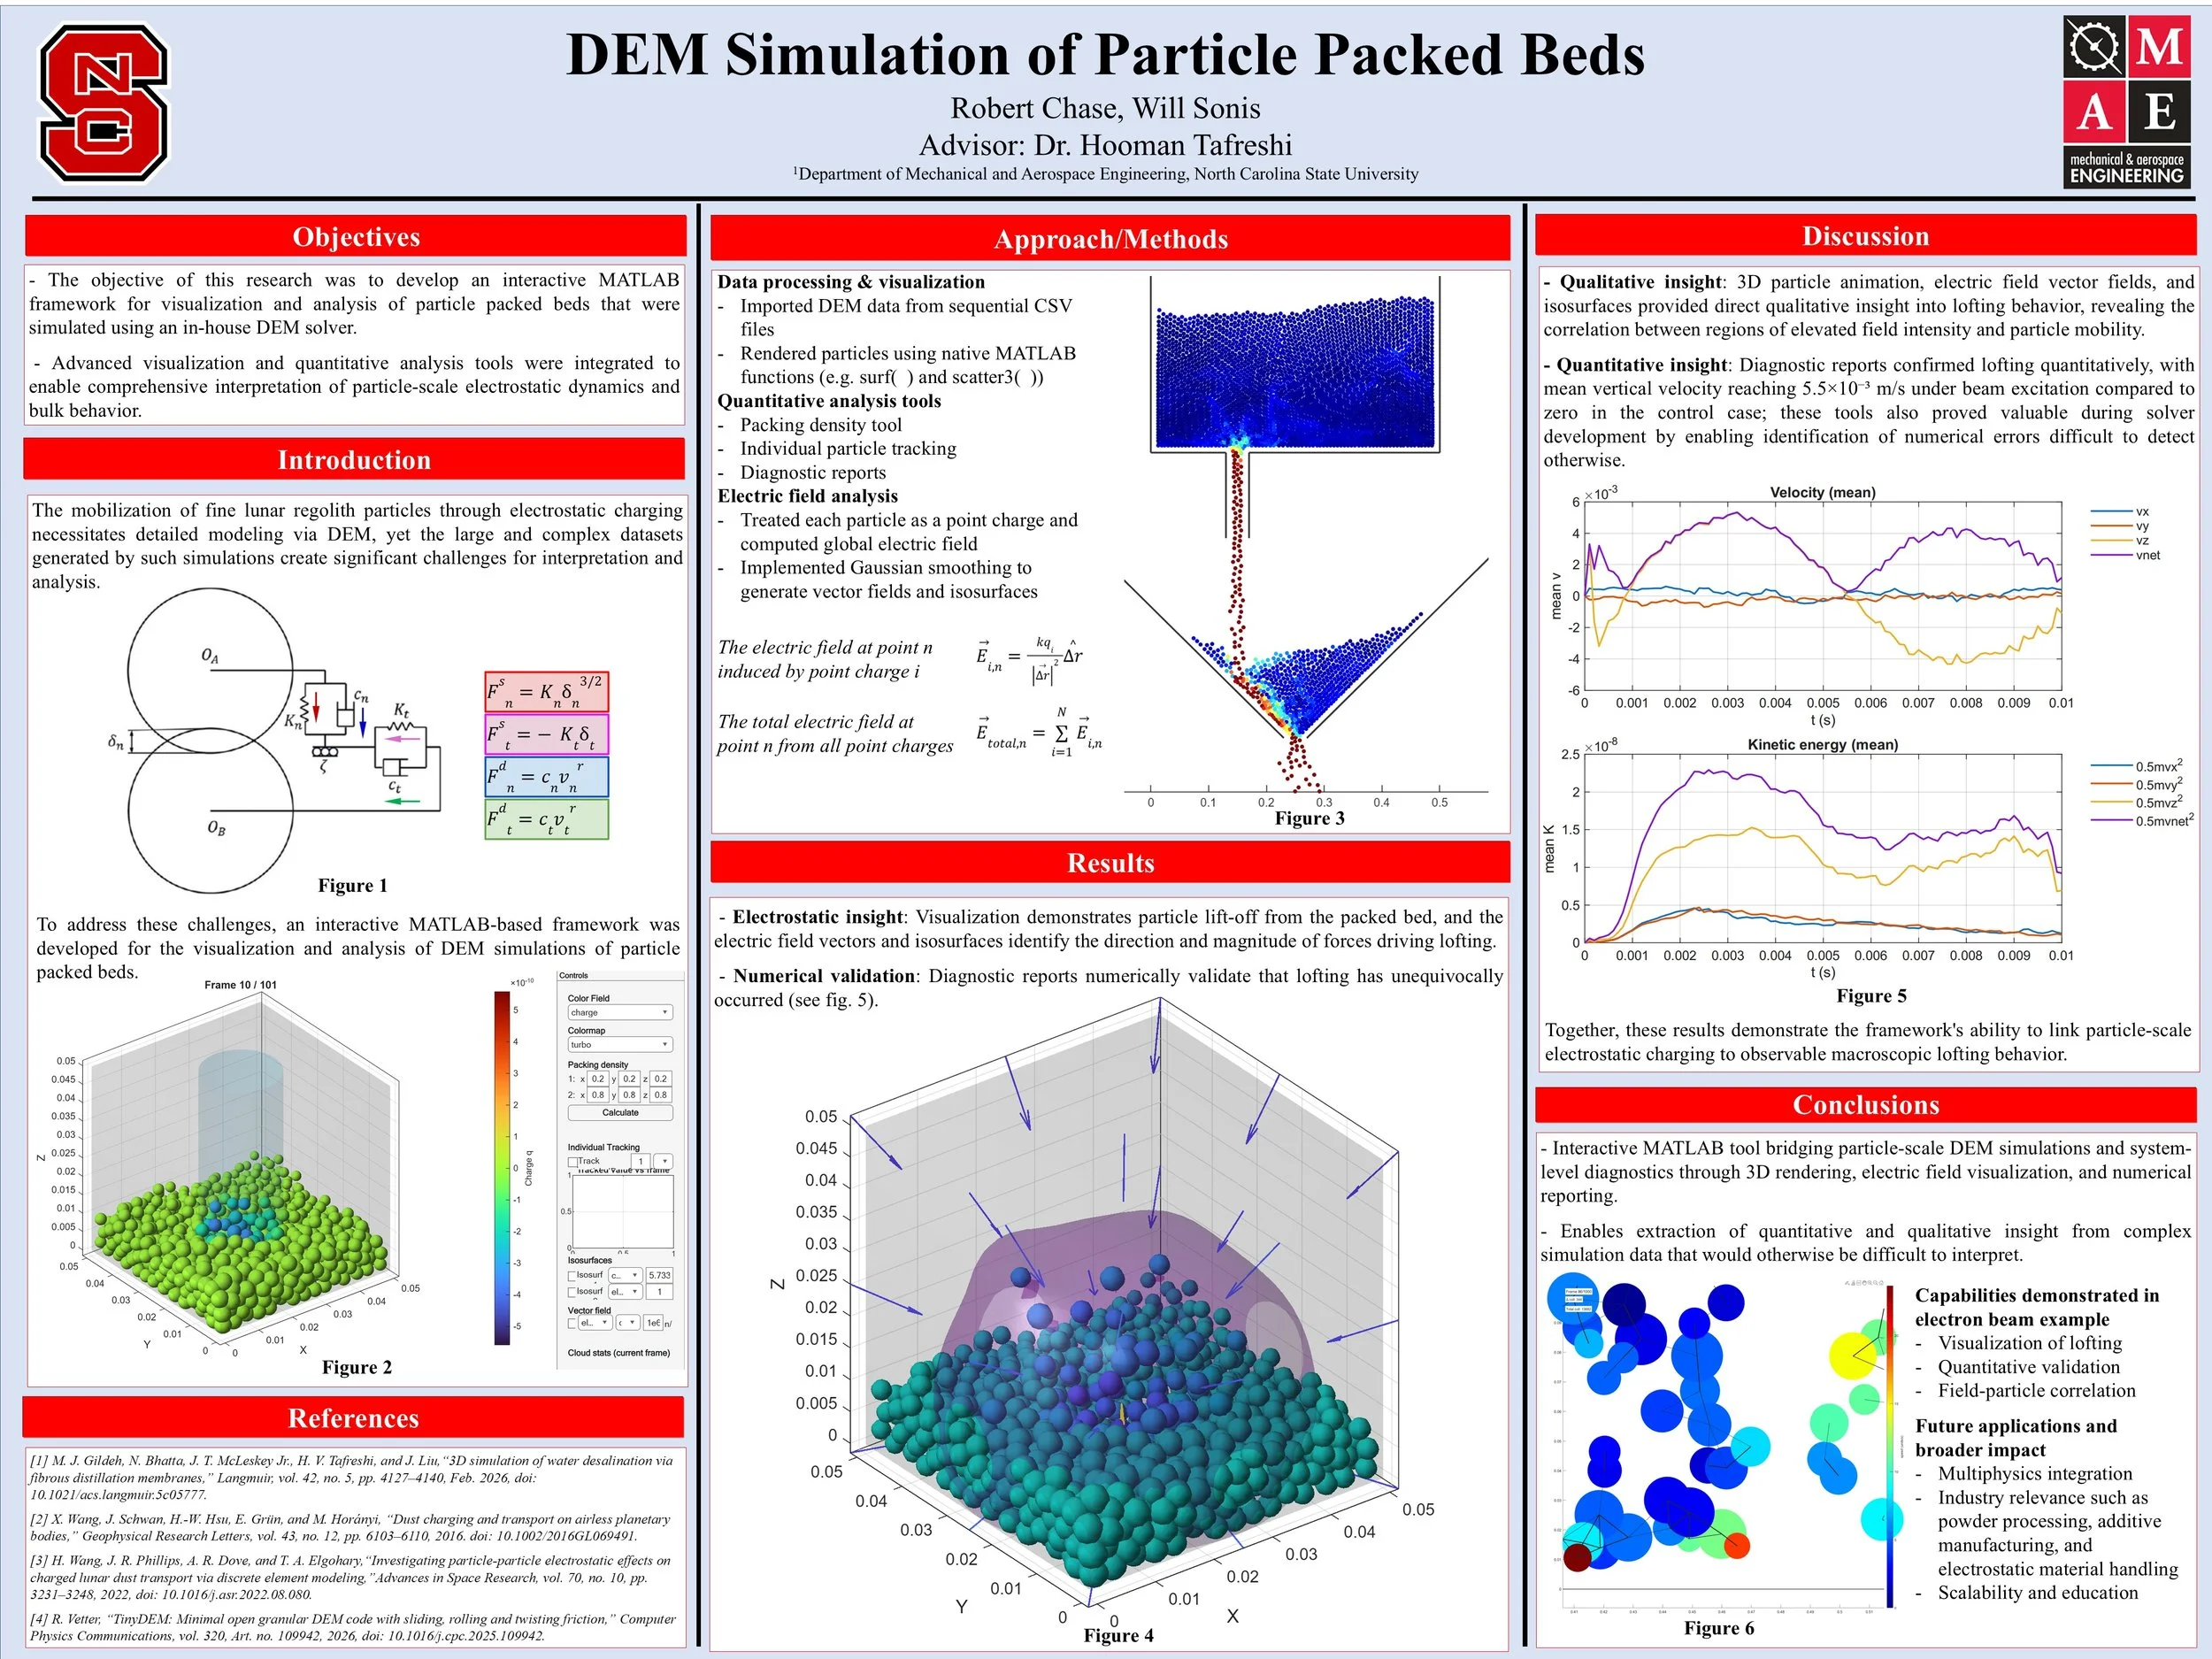
At the end of the year, I won 2nd place for my poster at the undergraduate research symposium.
Research Goal
The objective of this research was to enhance the understanding of particle packed beds and particle lofting simulated using the Discrete Element Method (DEM) through the development of an interactive visualization and analysis framework in MATLAB. This work focused on integrating advanced visualization with quantitative analysis tools to enable comprehensive interpretation of particle-scale dynamics and bulk behavior in packed beds. The DEM solver used to initially gather data is one developed by an NC State graduate student.
This research is the beginning of a greater effort to build an understanding on the behavior of lunar regolith lofting, a phenomenon in which clouds of dust form on the Moon, posing significant challenges to NASA and other agencies looking to land there.
Experience
At the beginning of my senior year, I was selected by faculty and offered a nomination to compete for the MAE Research Scholars Program; a competitive, paid research program for undergraduate students in Mechanical & Aerospace Engineering. After accepting the nomination and waiting some time, I was awarded a research spot in the Porous Media and Multiphase Flow (PMMF) Laboratory with Dr. Hooman Tafreshi as my advisor.
My role in the lab was to work alongside Will Sonis, a graduate student developing a custom DEM script with electrostatic physics, and analyze the results of his work using MATLAB. My primary focus was clearly visualizing the simulations and creating reports of global and individual physical parameters to validate the behavior of the system. My code proved very useful in validating the physics of the simulation and in finding unique insights into the particle’s behavior. For an in-depth dive into the actual research that I did and into my findings, feel free to download a copy of my final report below.
This experience was hugely beneficial to teach me how to use coding to solve real world mechanical engineering problems. This experience also improved my soft skills in the lab and in the office, as I presented weekly slide decks to our team and had to write extensive reports at the end of each semester.
Final Research Report
Gallery
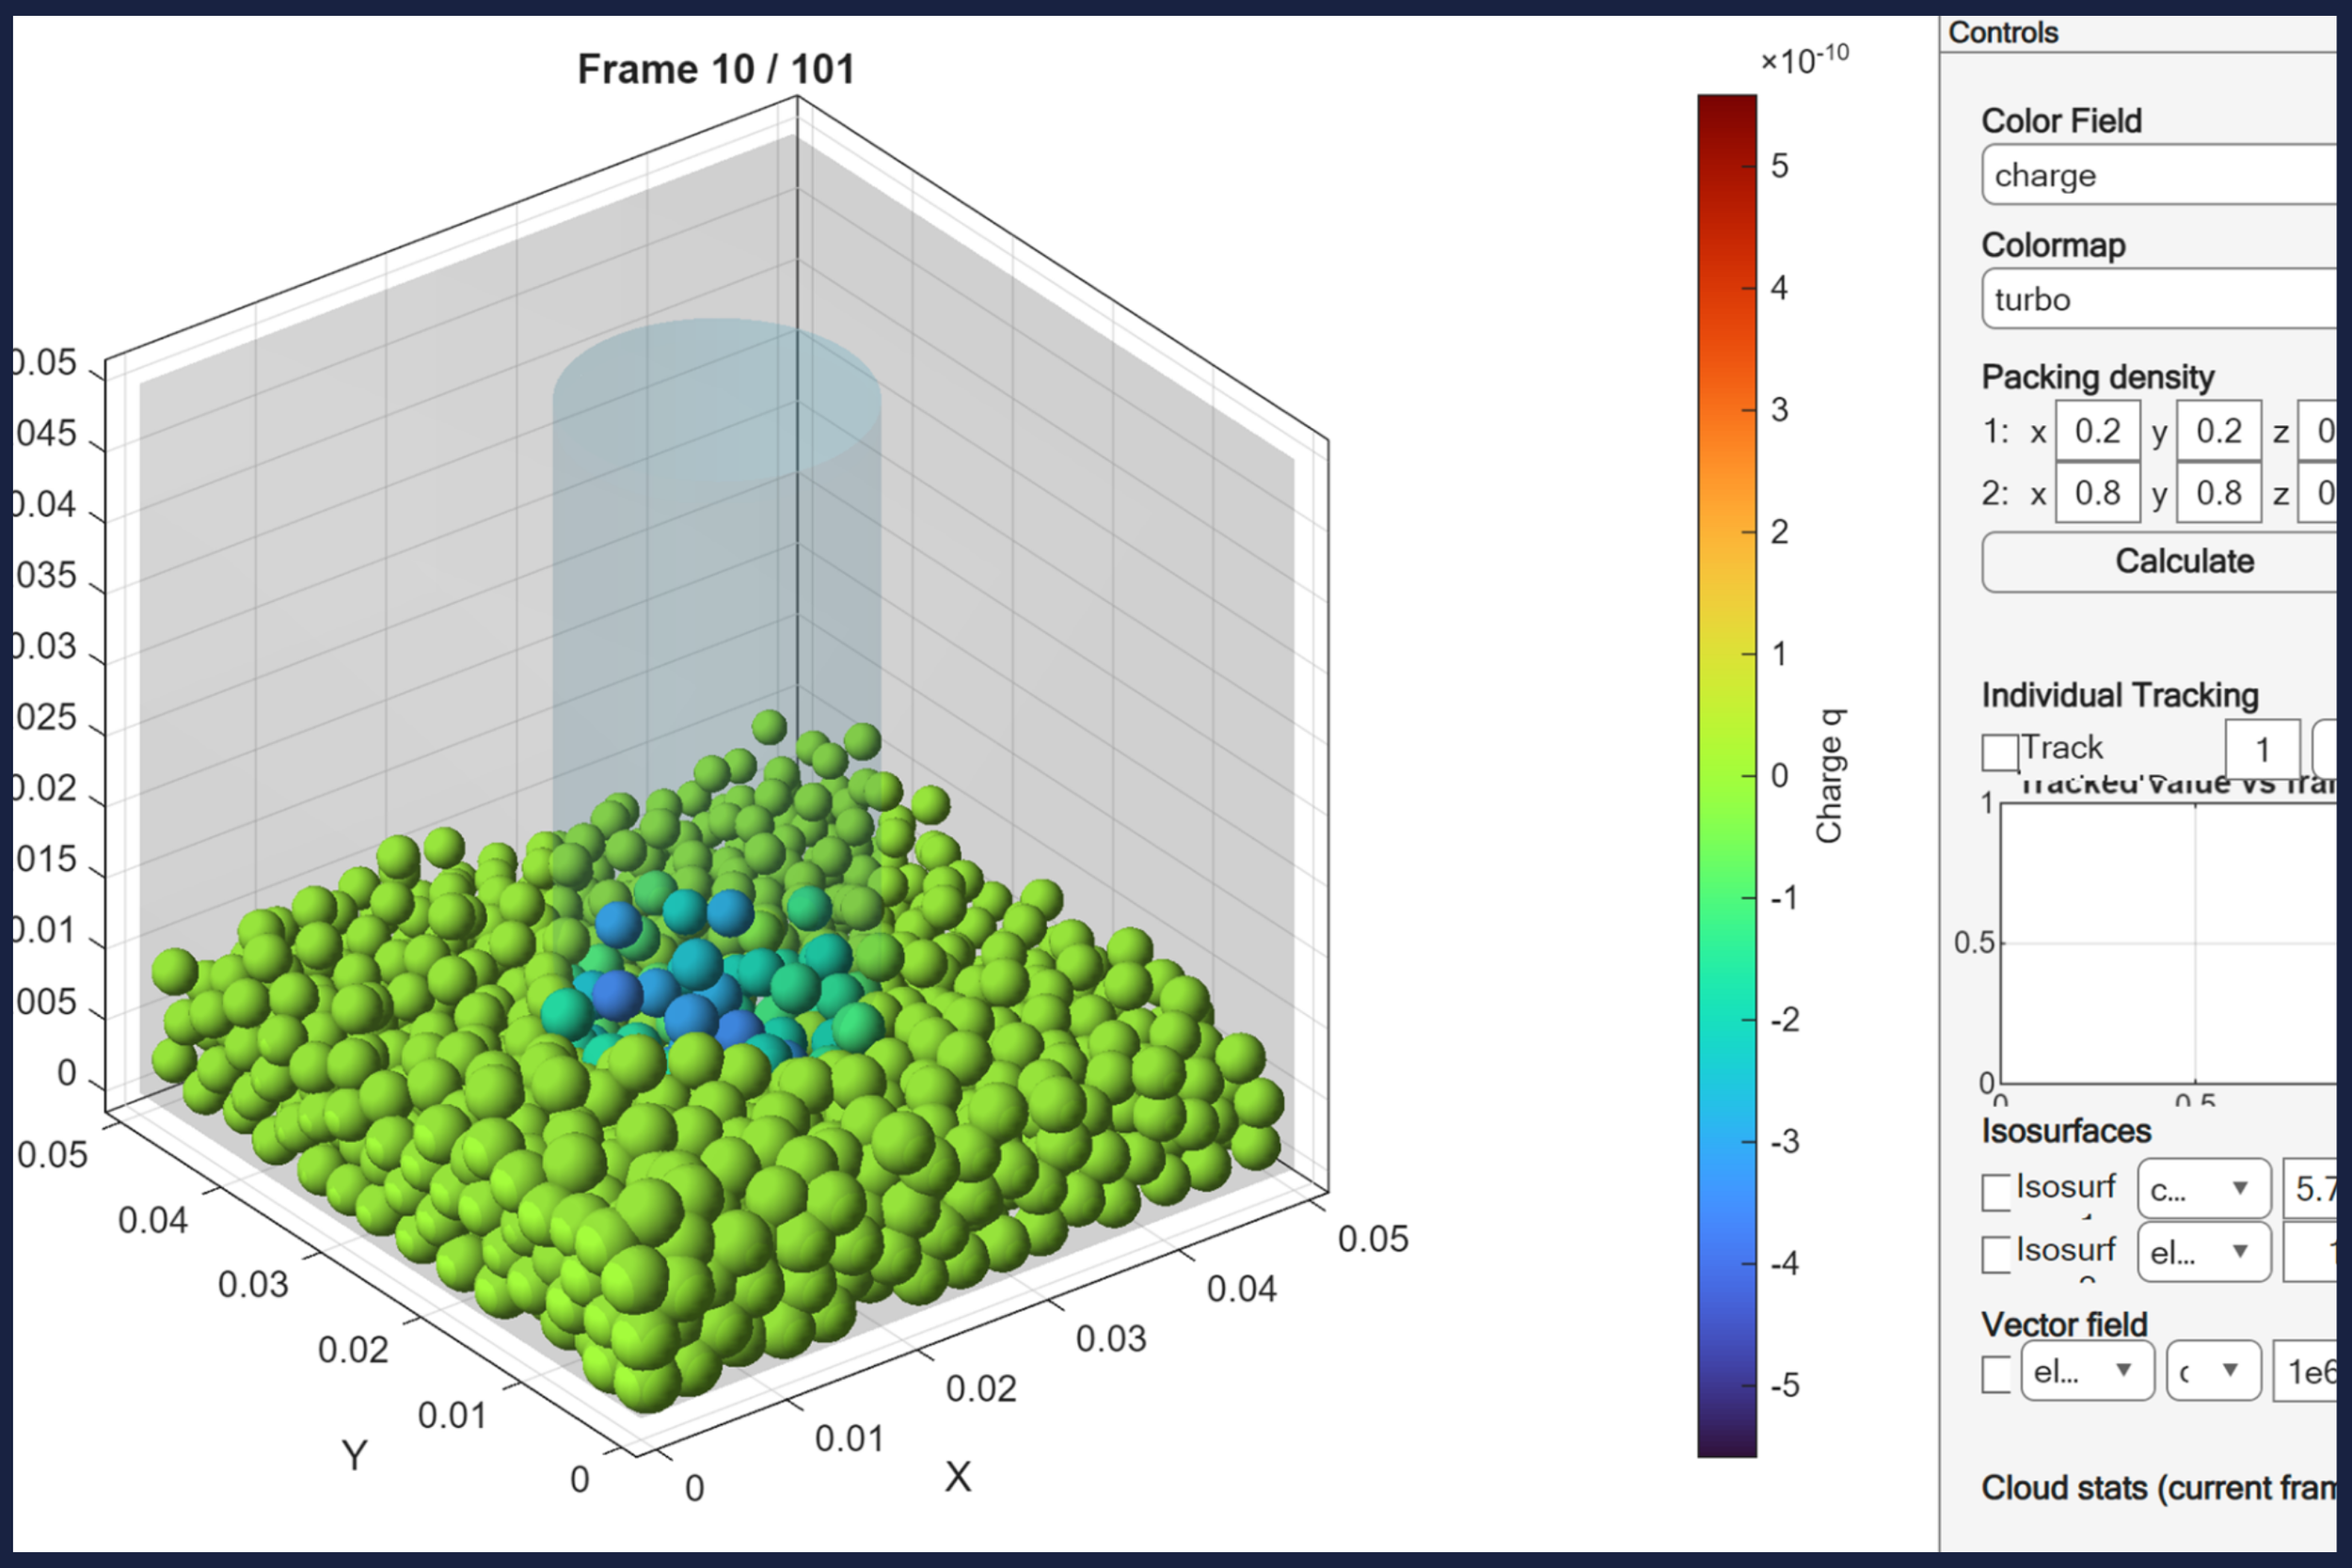
Graphical User Interface (GUI) for 3 dimensional simulations
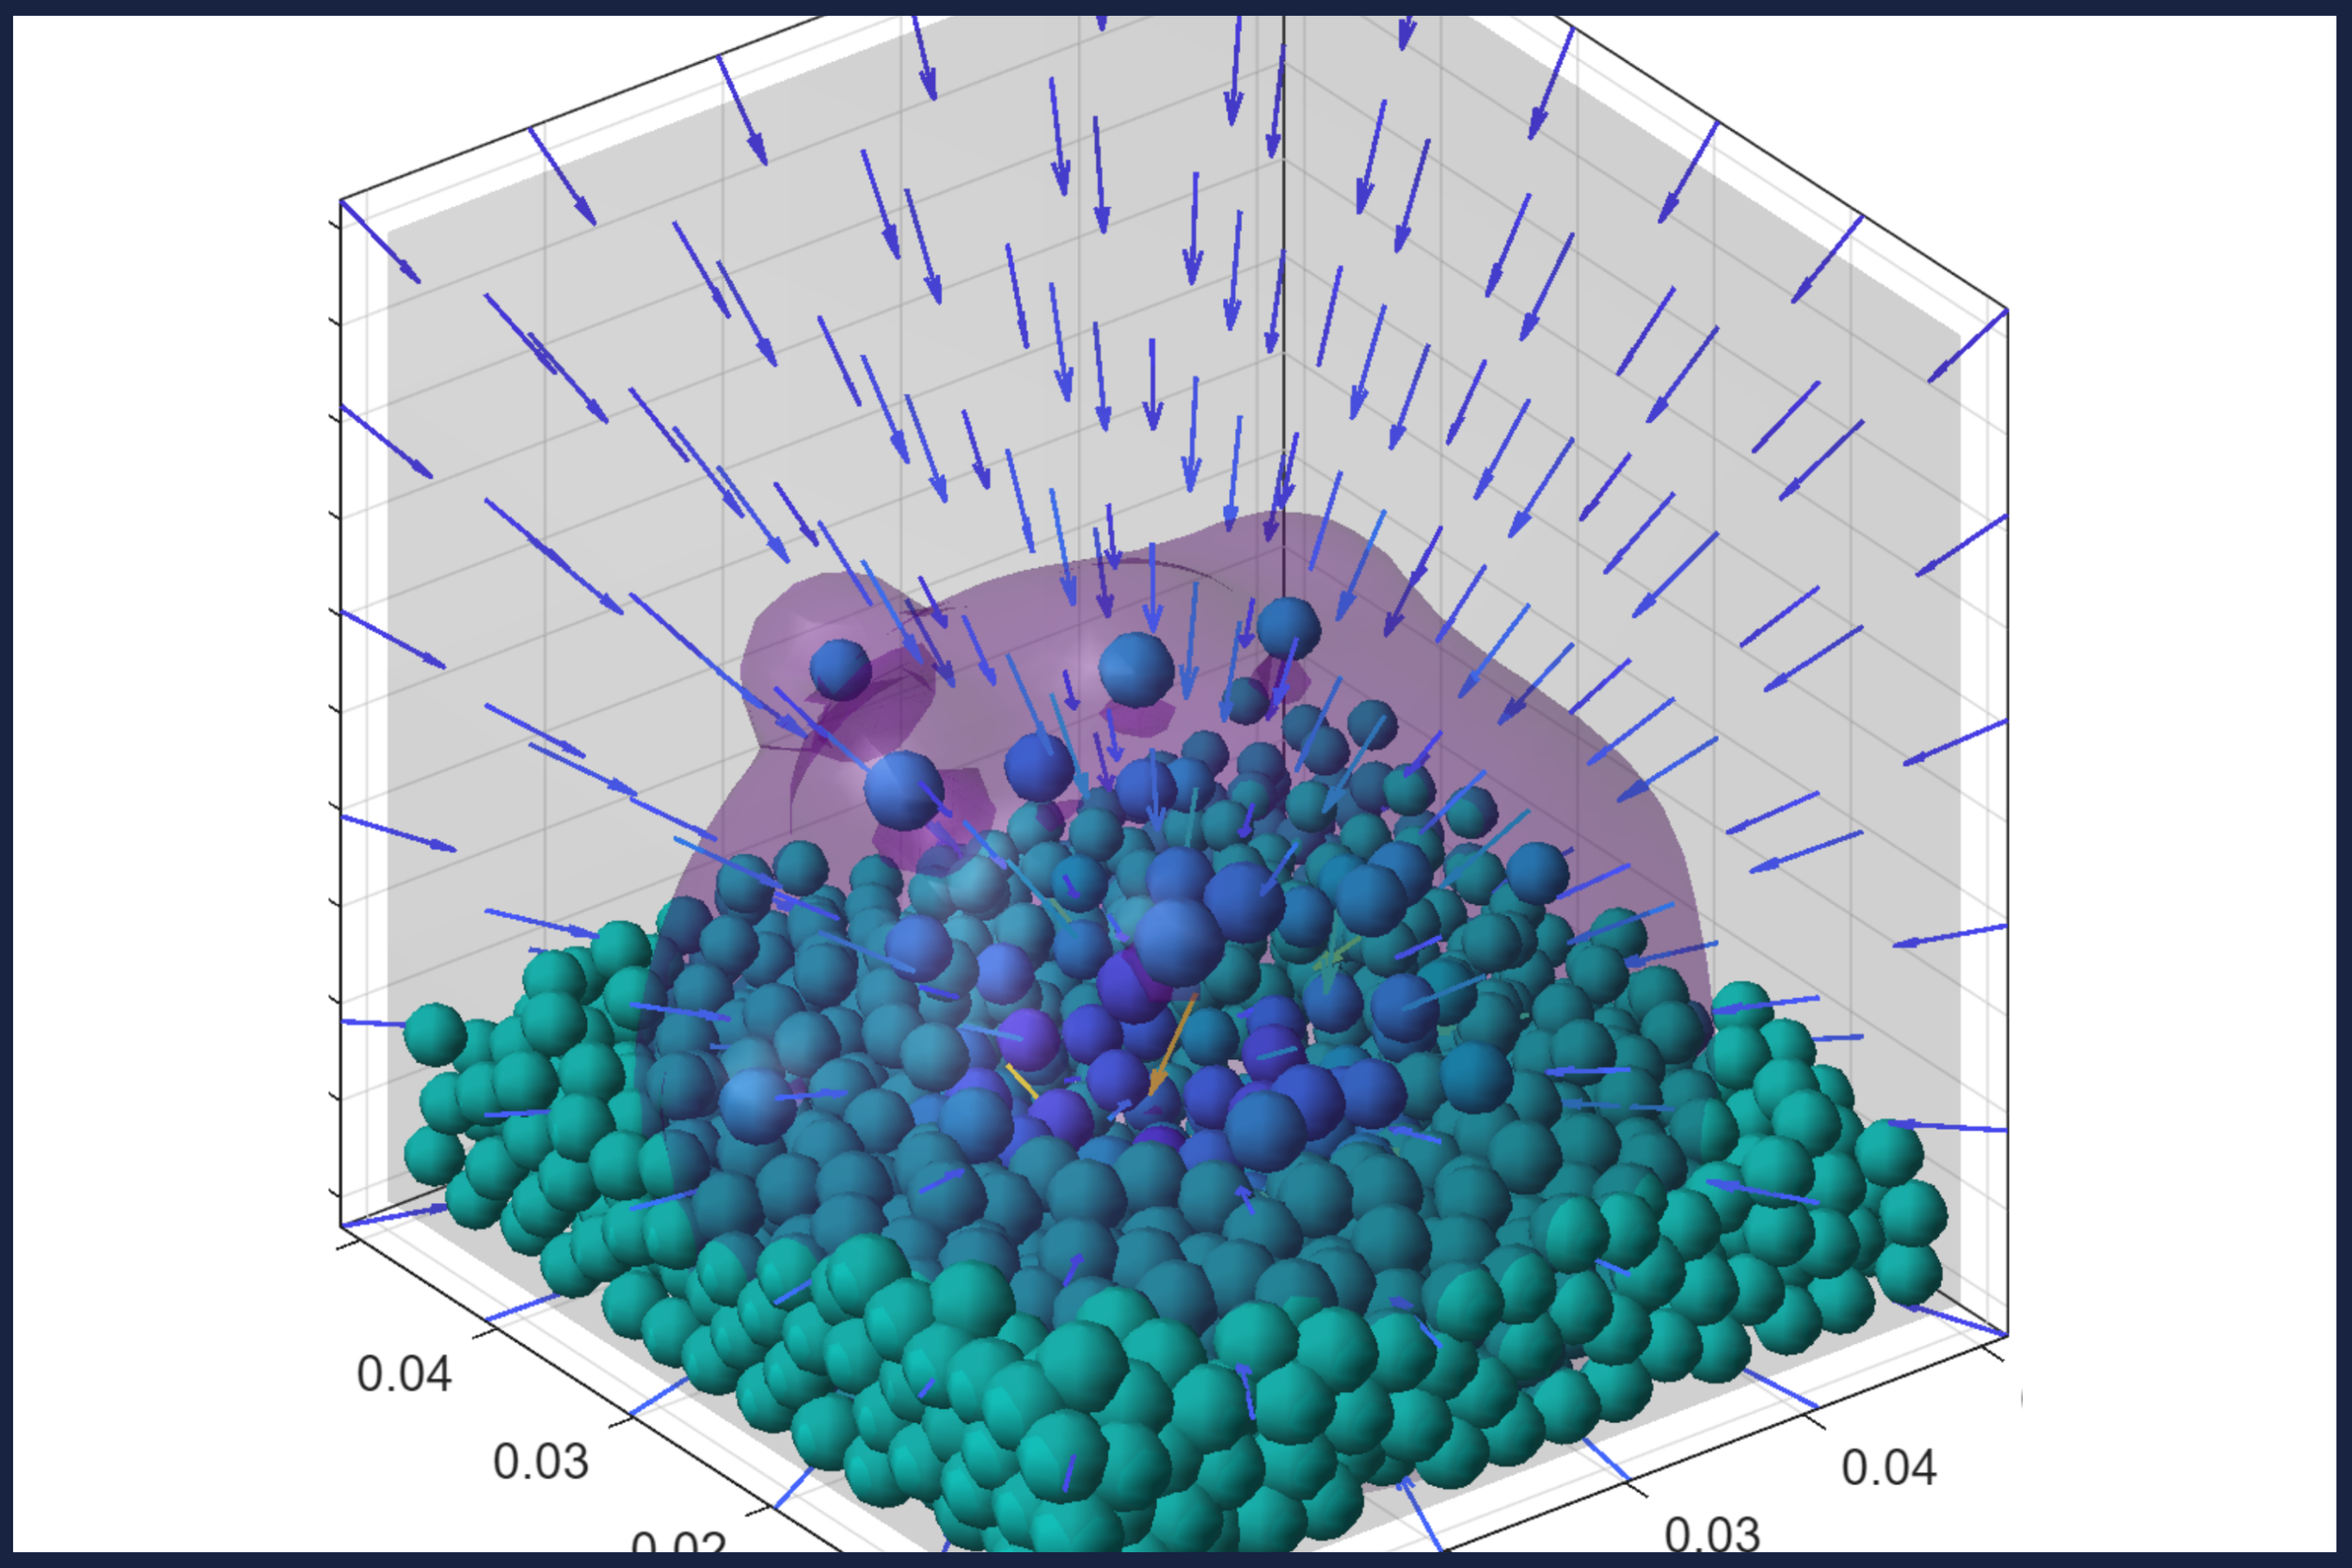
Rendering of electrostatic vector field and isosurface of electrostatic field in 3D. Particles are colored based on their charge and arrows are colored based on their intensity. The entire area of the isosurface represents one specific magnitude of electric field.
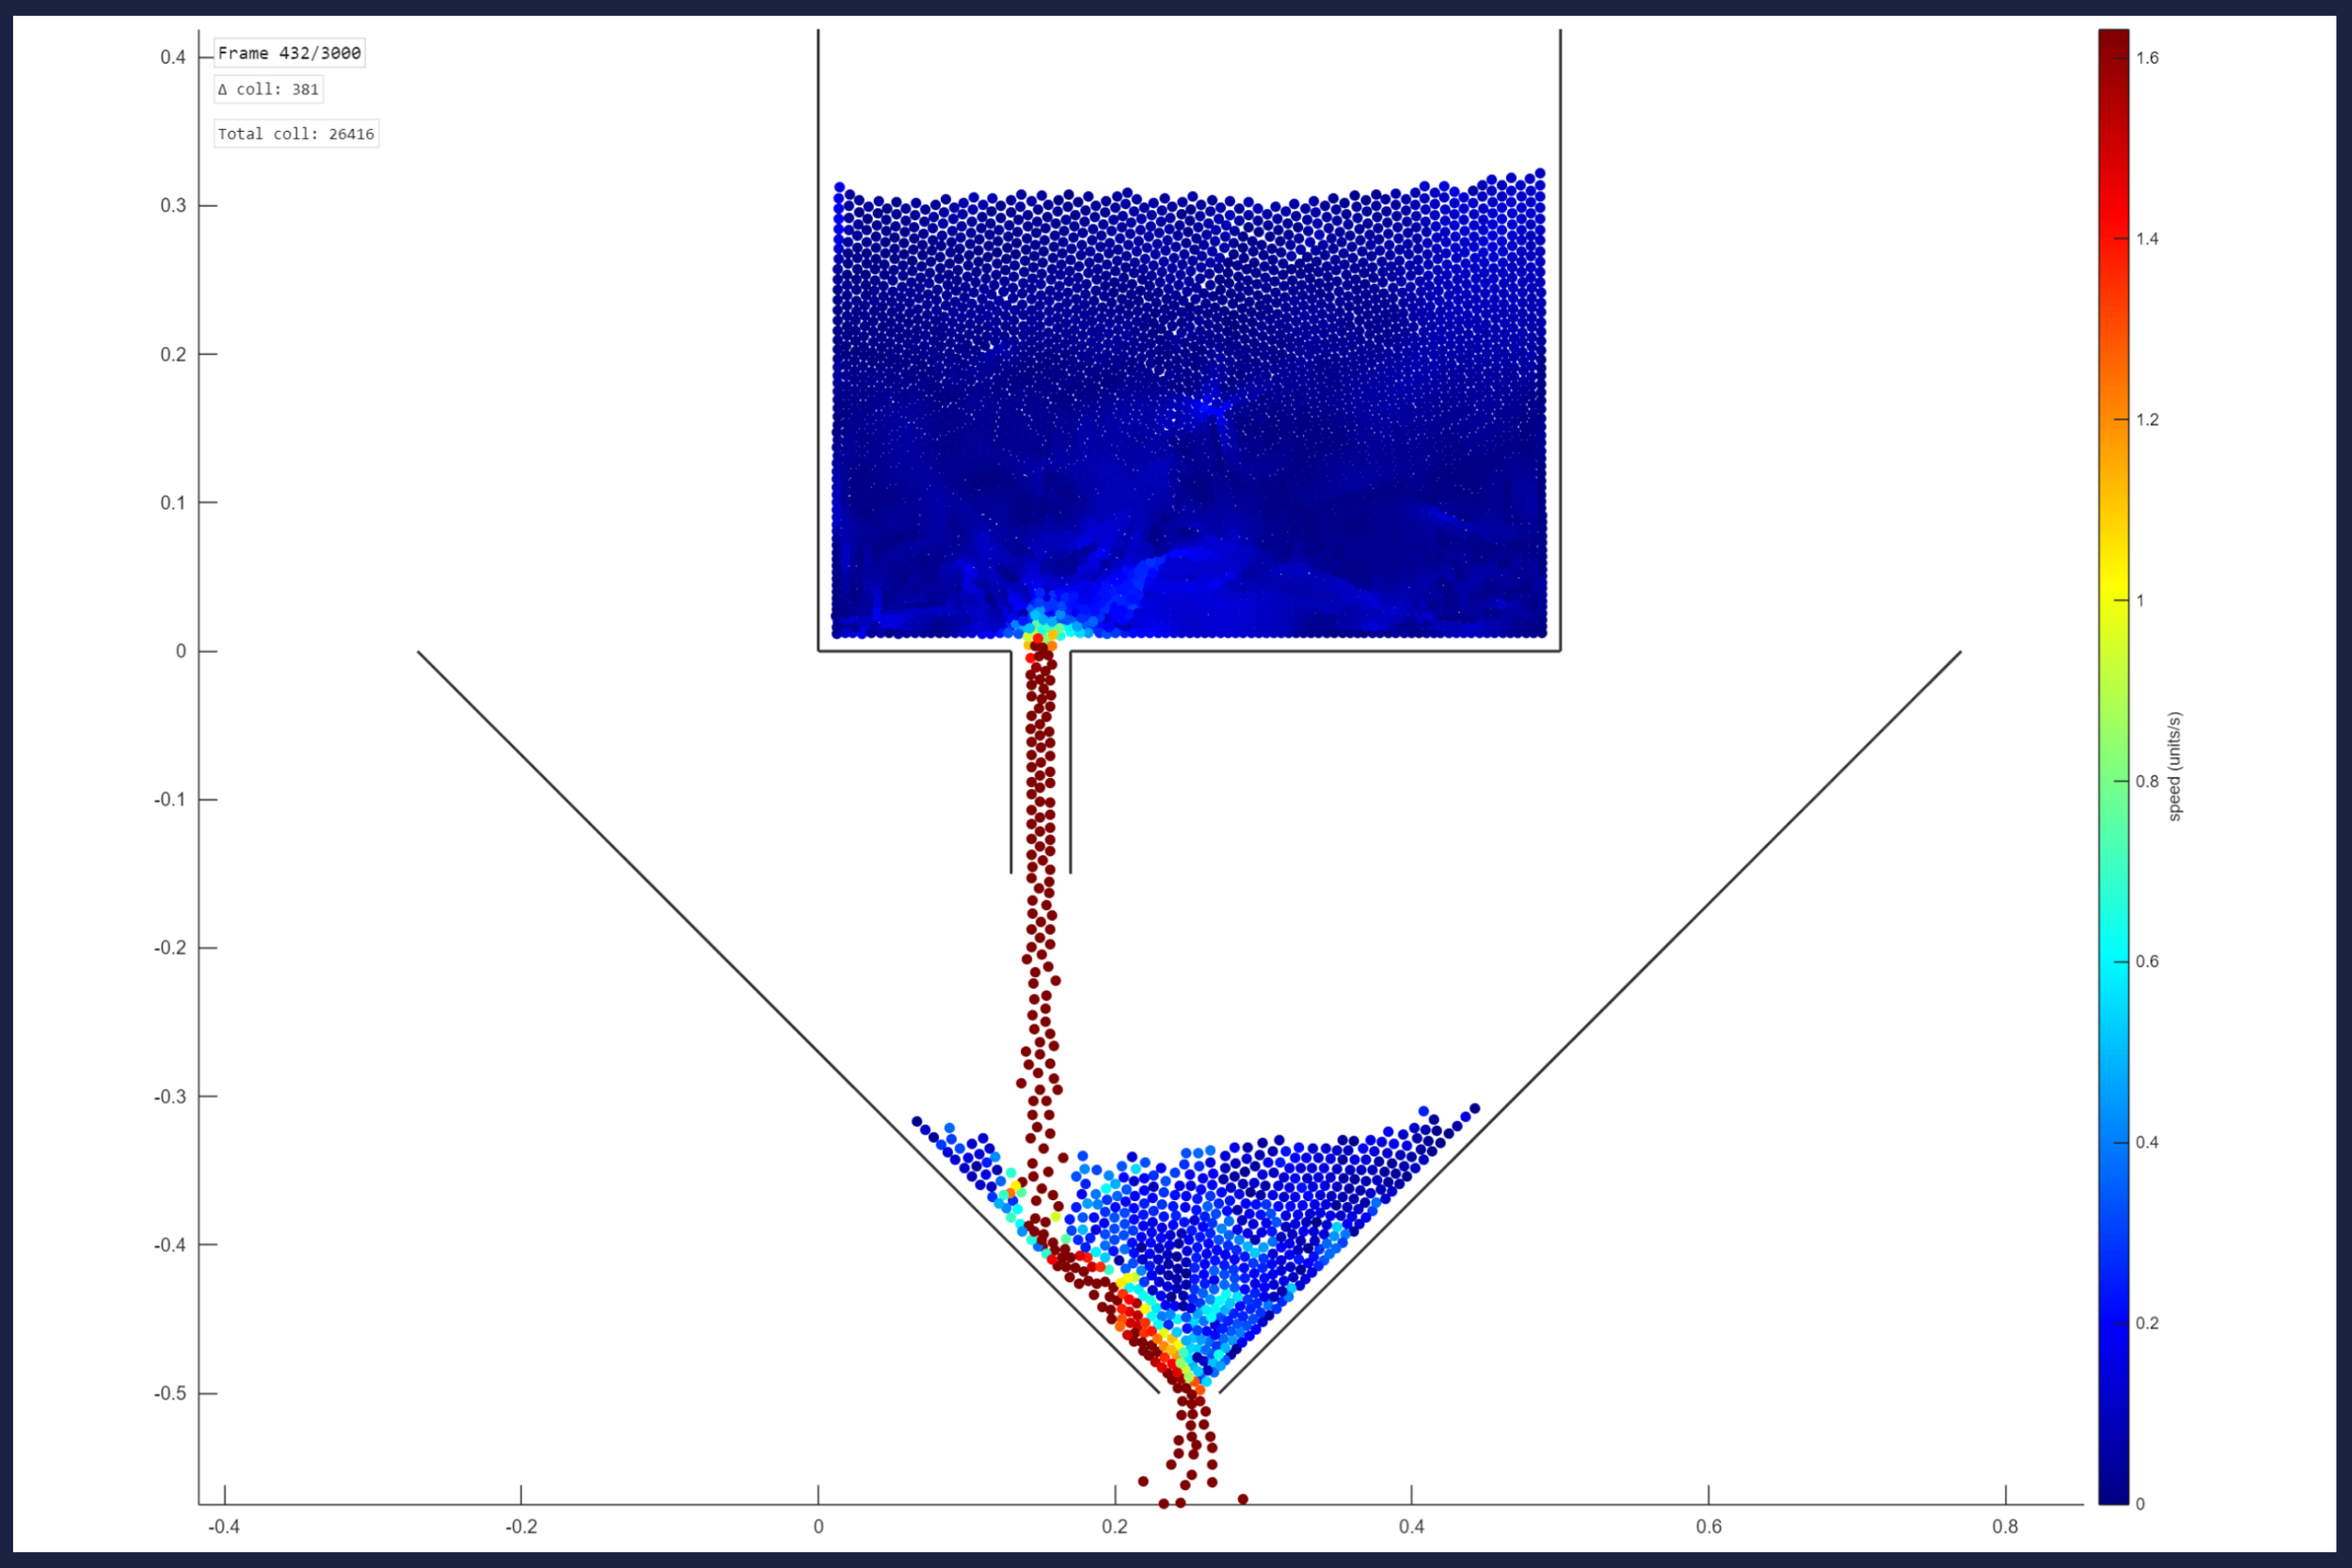
GUI of 2 dimensional simulation. This figure is from one of the funnel tests conducted.
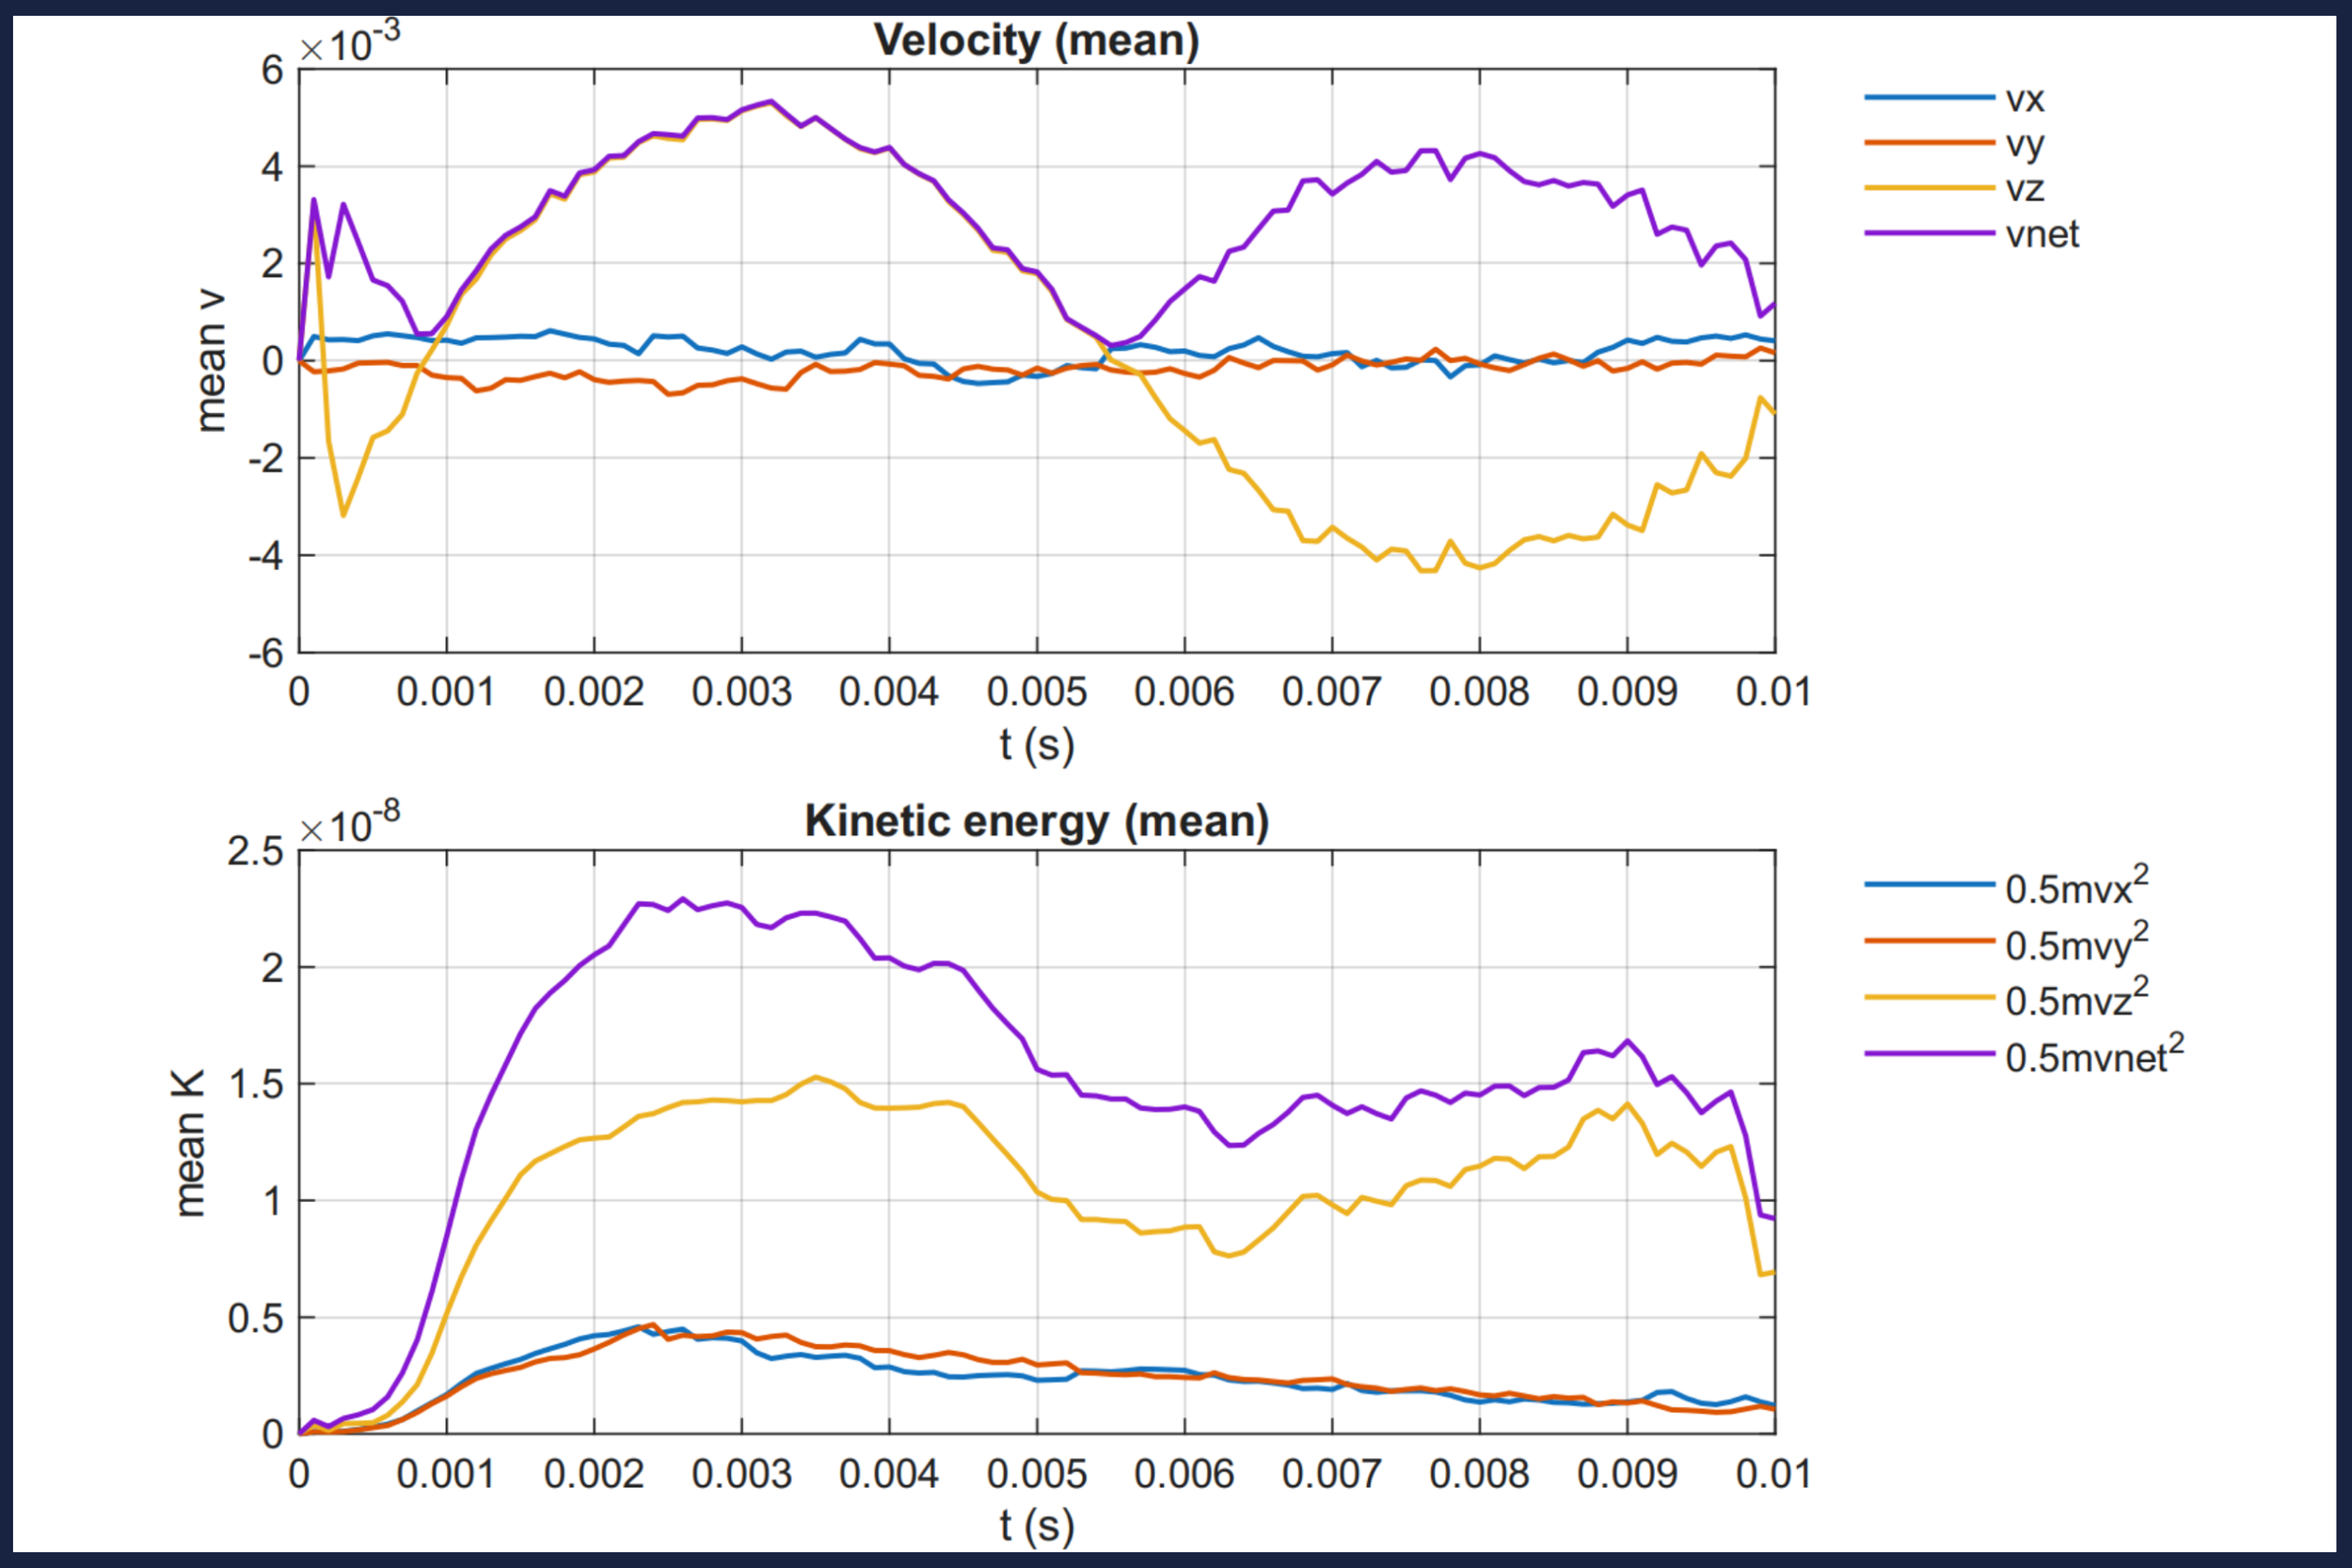
A sample of the diagnostic reports used to quantify global particle behavior and validate simulation physics.
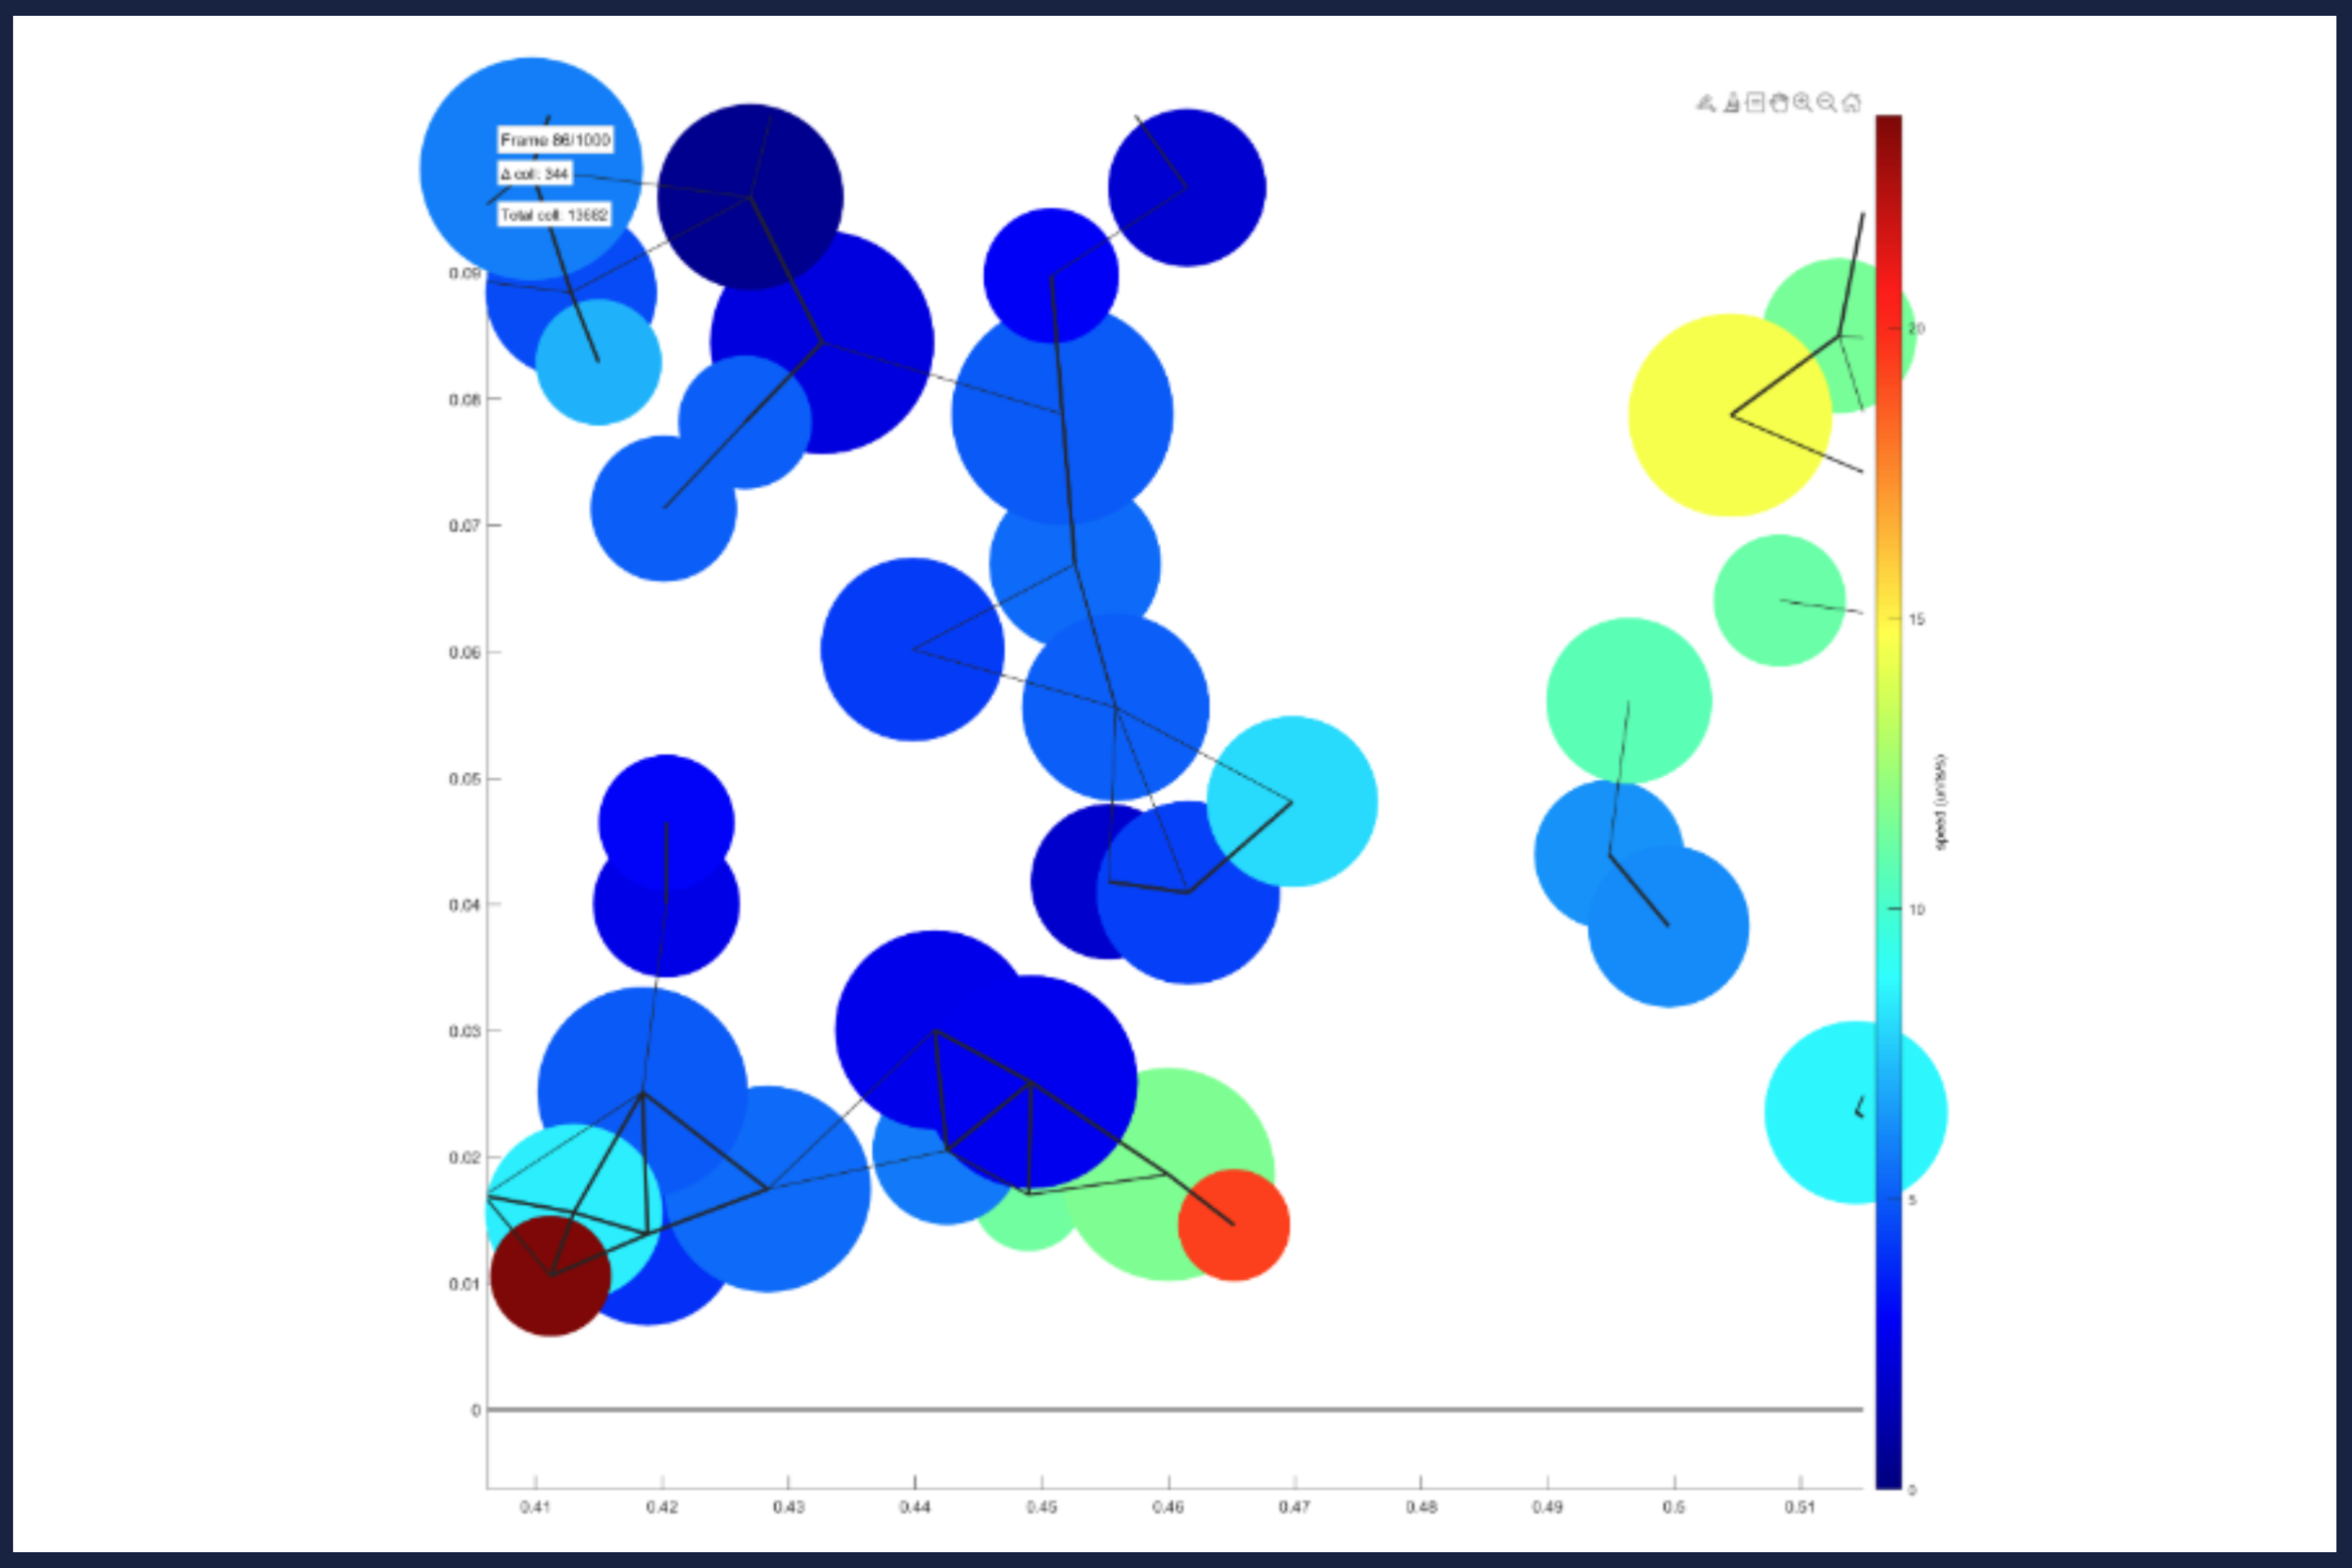
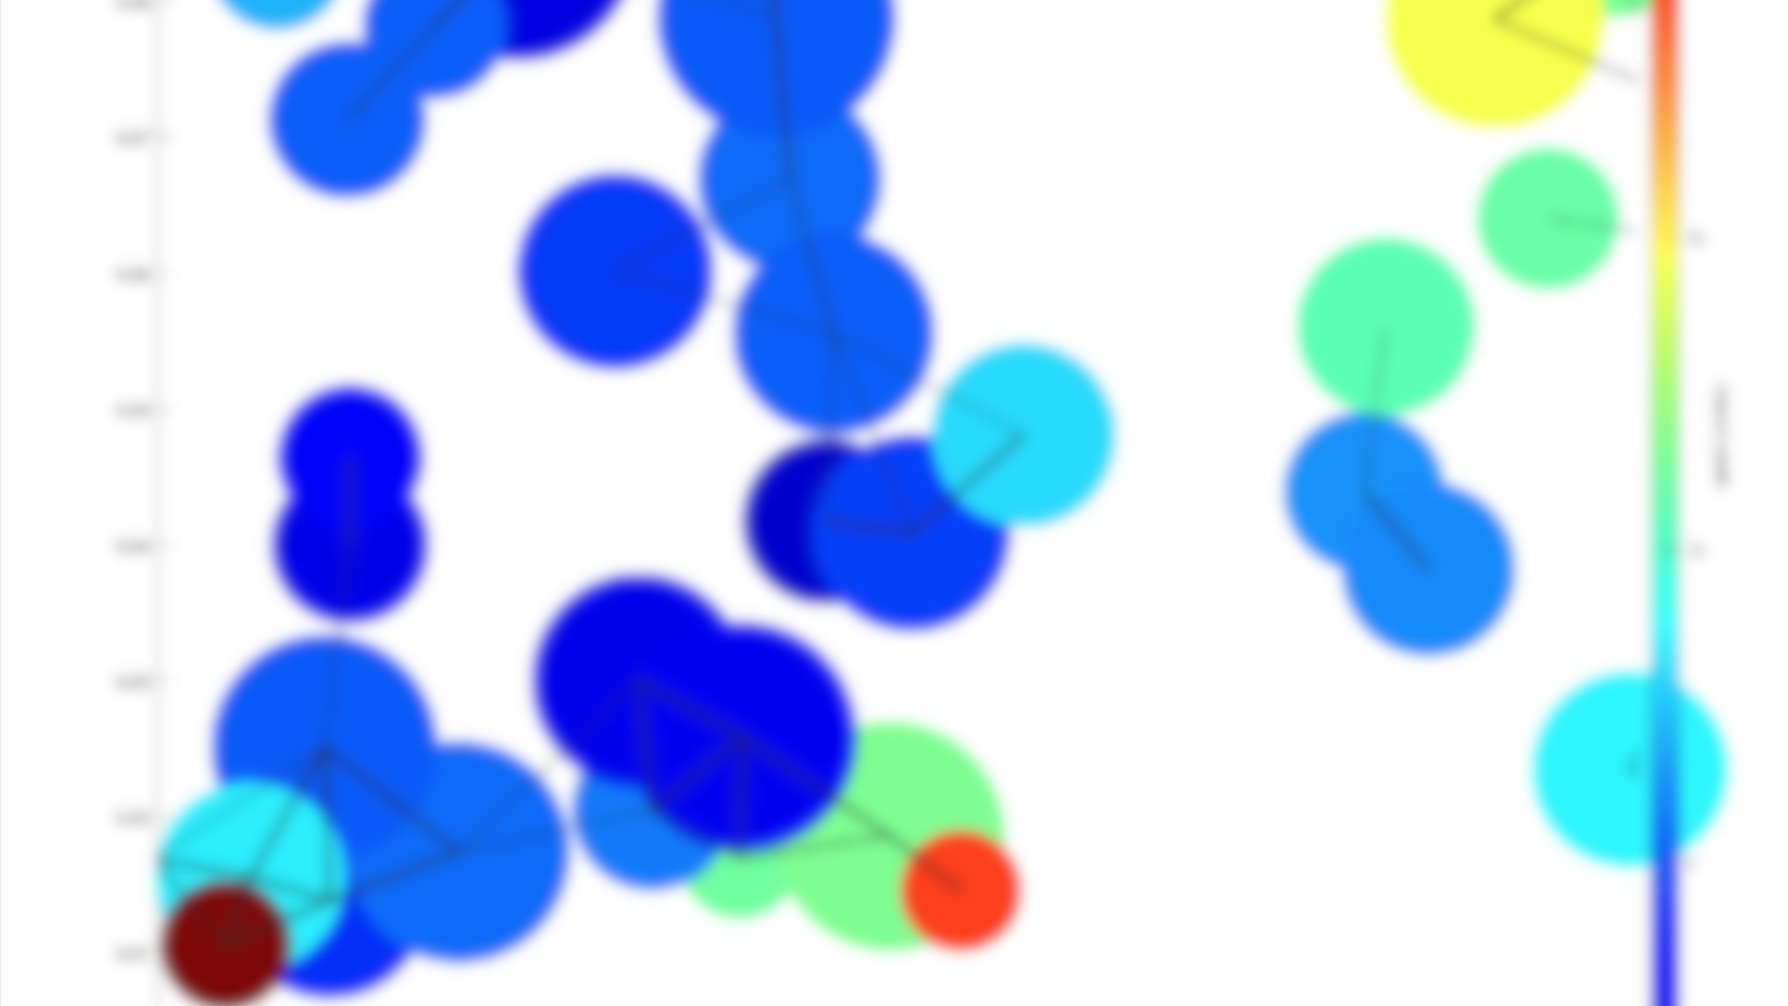
This figure shows a close up of particles in 2D. It highlights the force chains between particles, which visualize how force is distributed between moving particles and packed particle beds.
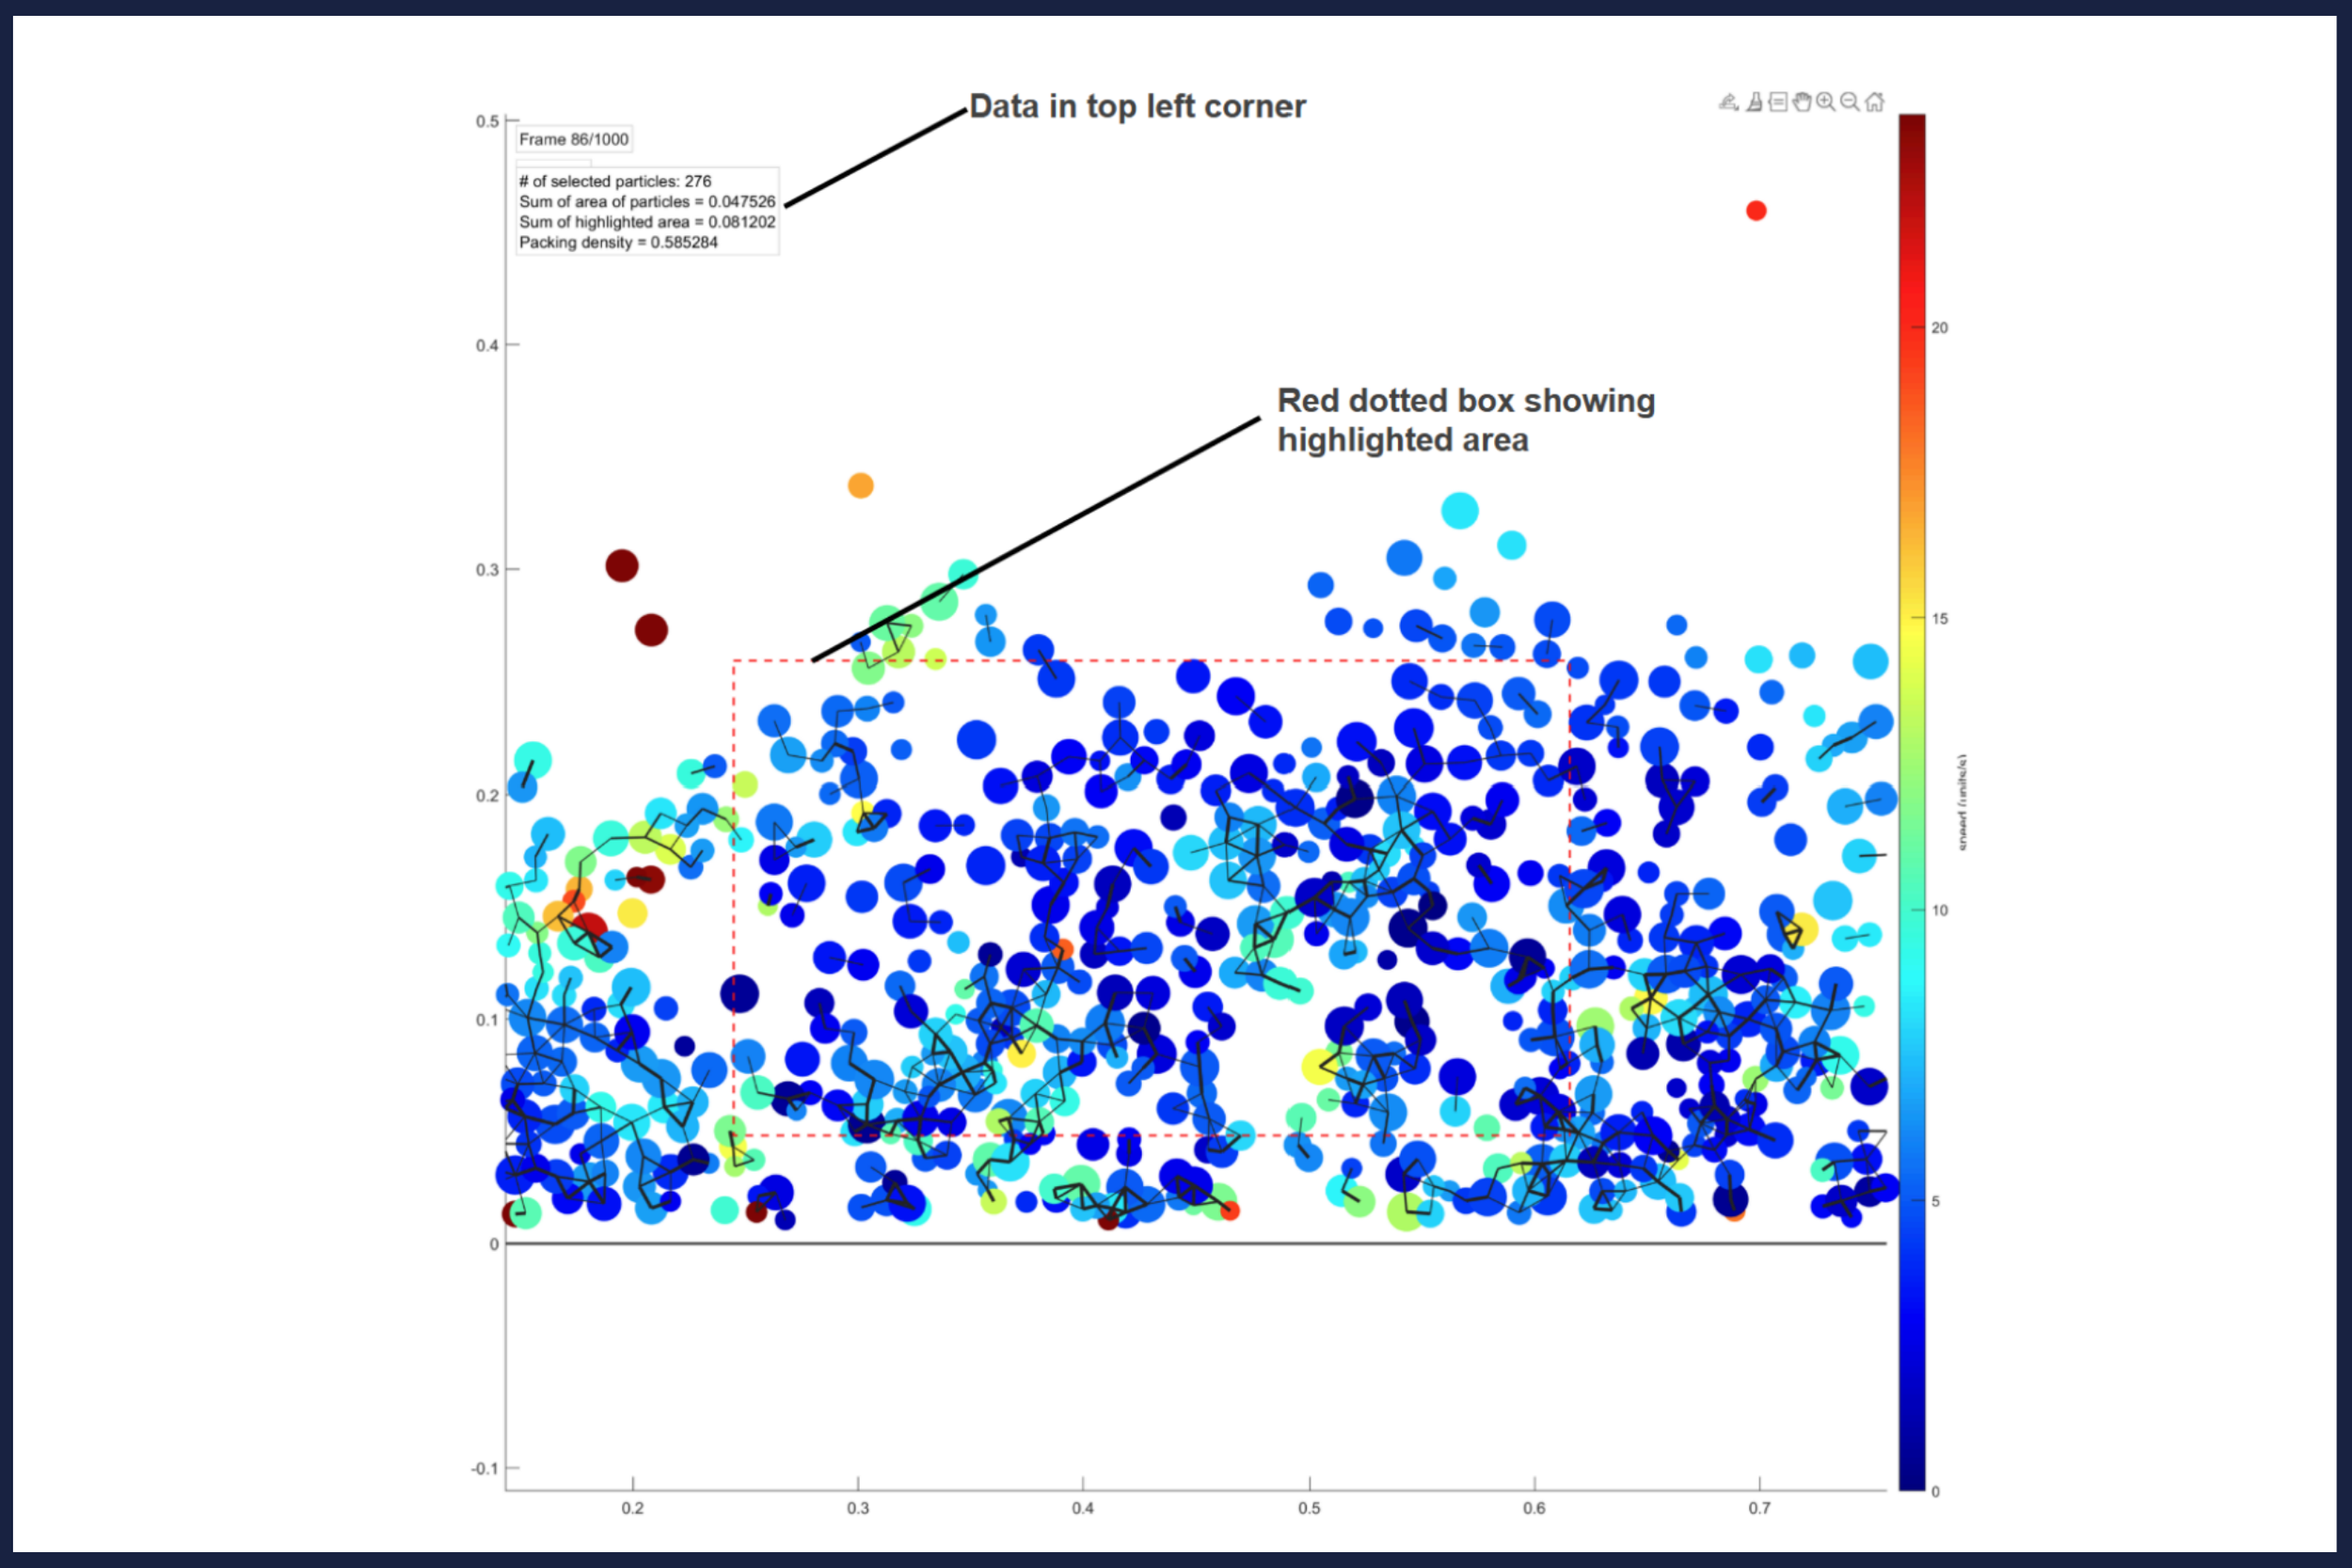
This figure highlights the packing density tool
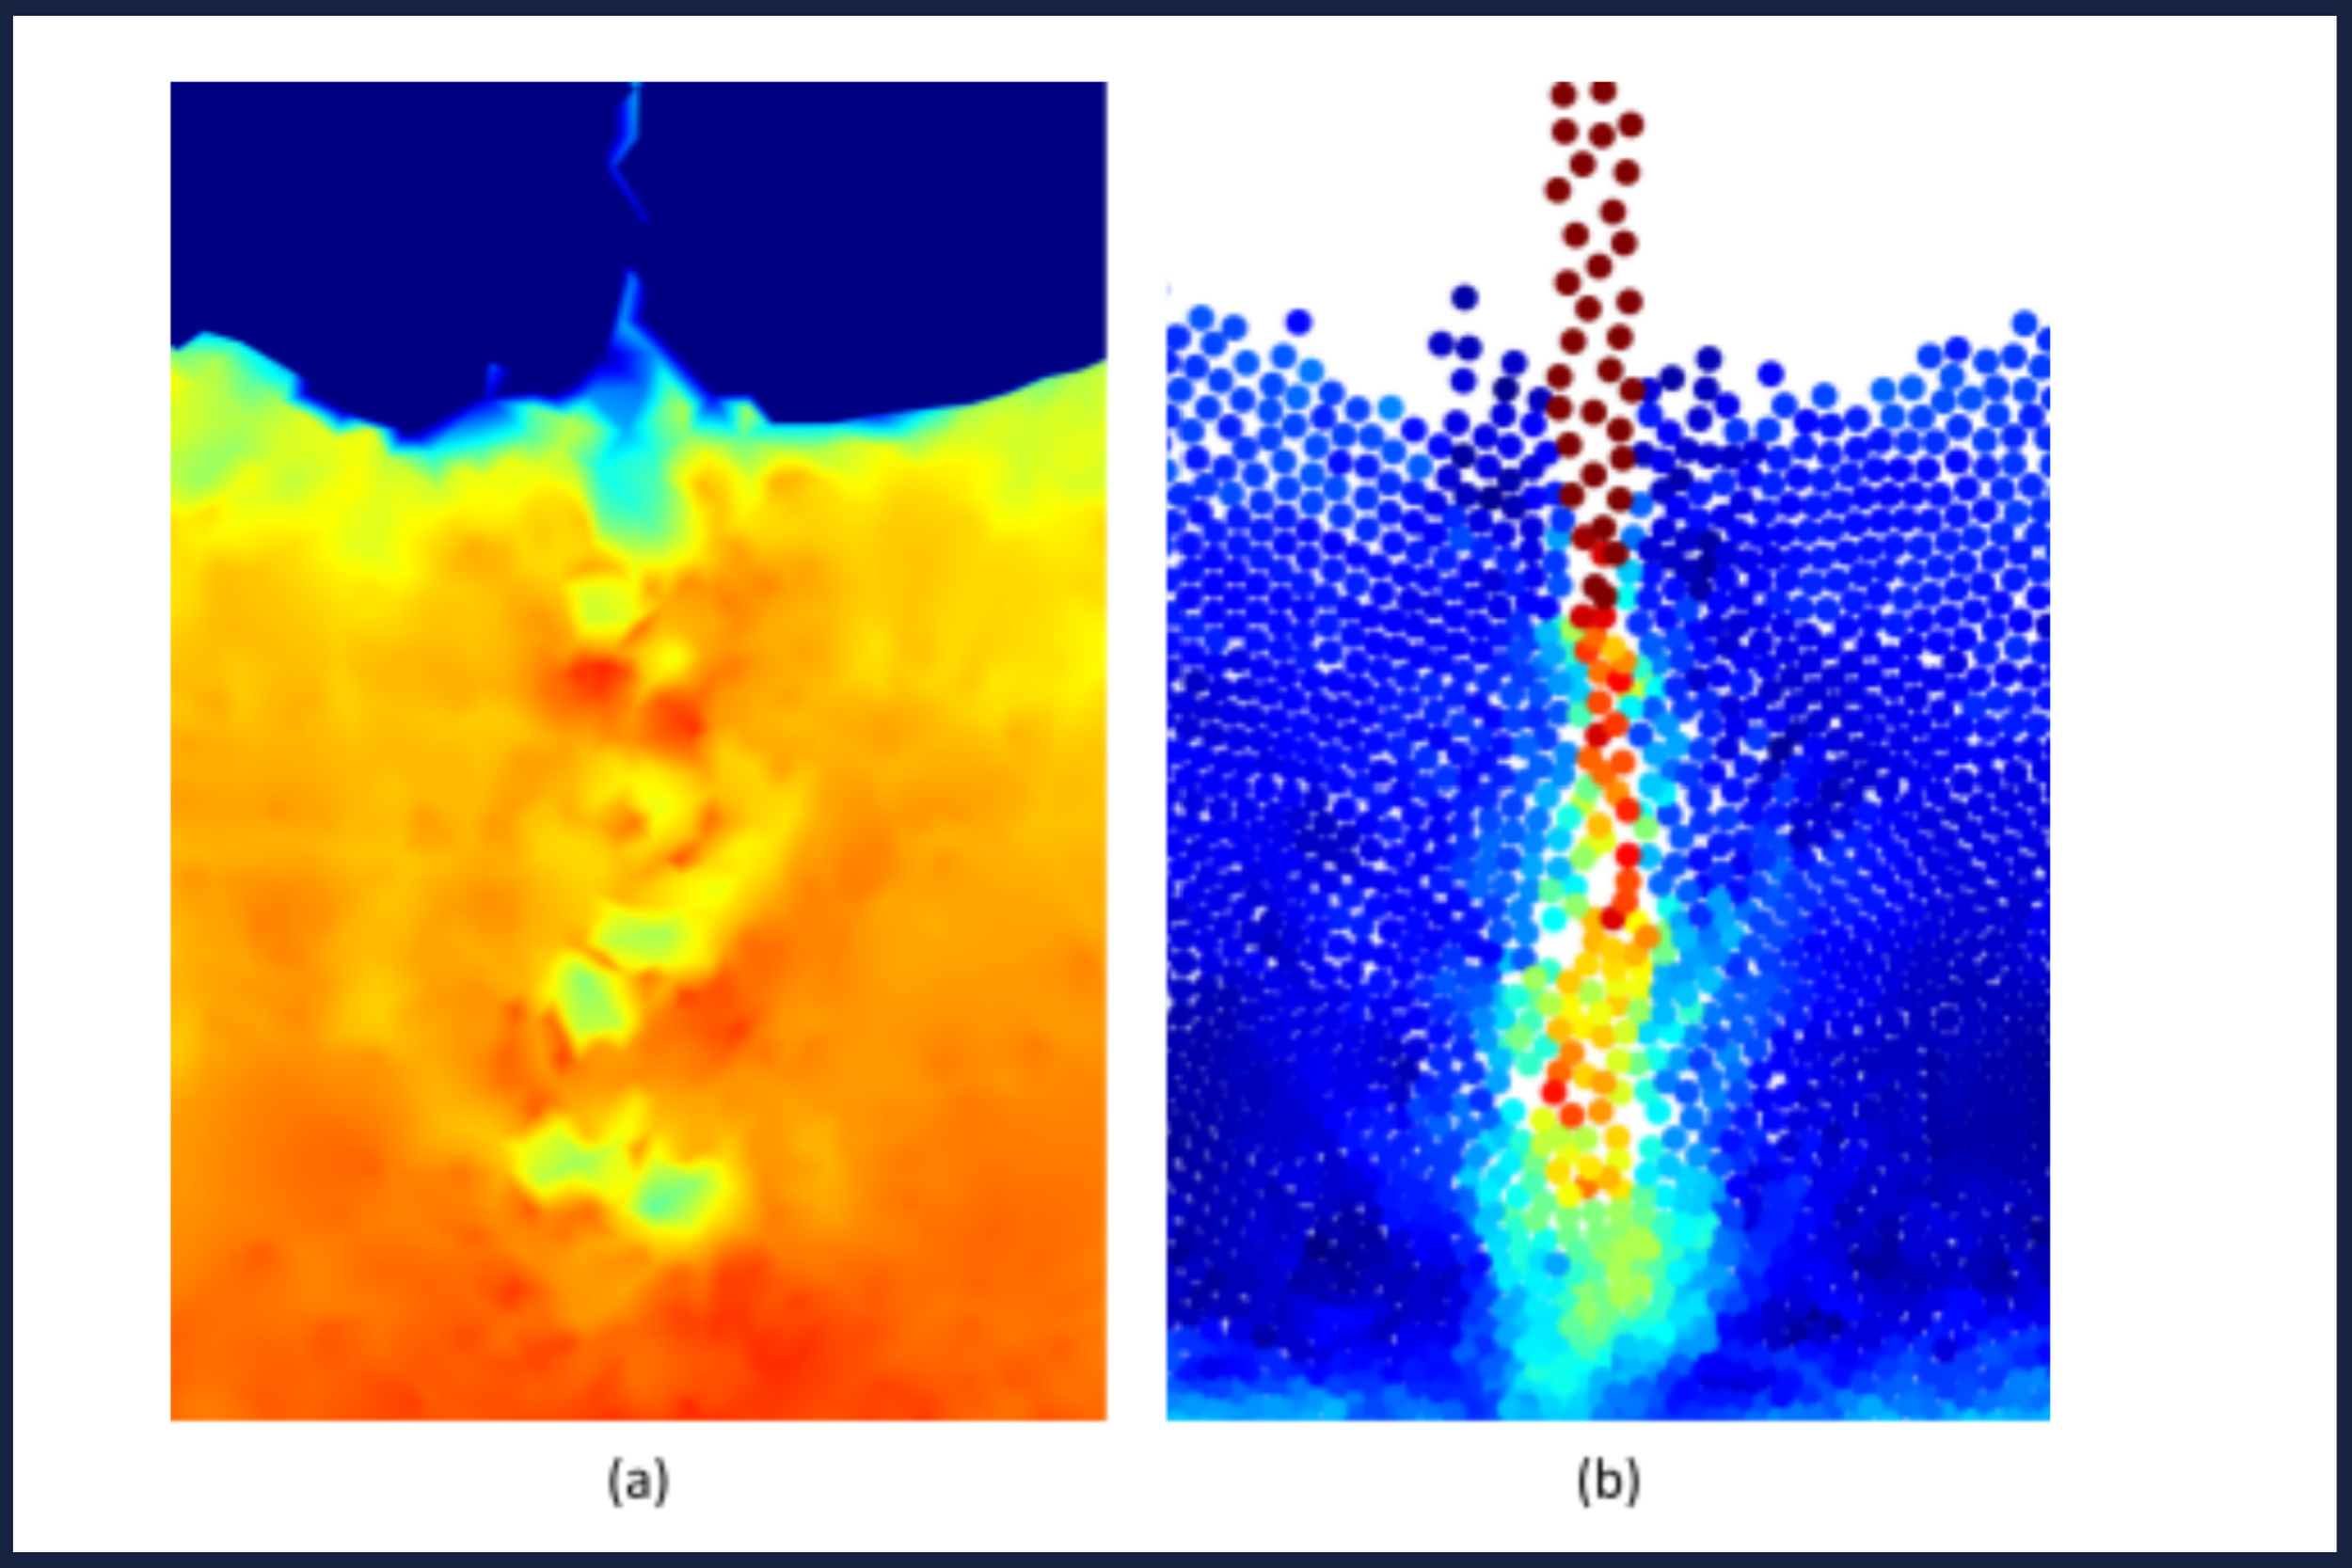
These images are from the same frame in a simulation.
Figure (a) has pressure distribution turned on and figure (b) has particles colored based on their velocity.